Final Projects:
Format of the Final Project
For each project please include these four sections.
Introduction
Describe what you are trying to do, which signals you are using, and any of the background you need to understand your project. Assume the audience is someone else in the class.
Methods
Describe what your system does conceptually, and how you implement it in matlab or python. Go through the system step by step, and show example signals at each stage to demonstrate that it is doing what you think it is.
Results
Show example results. How do you know it is working? How could it be improved?
Conclusions and References
Conclude with a brief summary of what you have descovered, and provide references for any sources you've used. There are lots and lots of web sites that have information, along with lots of sample code. Any of these are fine to use. In the end, though, make sure you implement the algorithms yourself.
The goal is something of the scope and content of one of the labs we've done this quarter. It isn't just getting something working, someone should be able to reproduce what you've done based on what you've written.
Extensions of Previous Labs
For the final project, you are welcome to do anything you find interesting. There are several that involve improving one of the labs we've already done. There are several options here.
Commercial FM Receiver
For the WBFM lab we just demodulated the left+right (mono) channel. The one excellent project would be to extend this to recovering to stereo. The spectrogram of the decoded signal looks like this
The location of the various signal components are
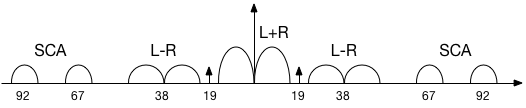
The mono L+R signal is centered, and the L-R signal is offset to 38 kHz. To create the left and right channels for stereo we need to extract both the L+R and L-R signals and combine them. The addition will give the left channel and the subtraction will give the right channel.
The trick is the must be in phase, or the separation won't be perfect. To do this, there is a 19 kHz plot tone in the signal. You can isolate this signal with a filter. If you square it, you generate a 38 kHz signal (plus DC, that you should suppress). That 38 kHz is perfect for demodulating the L-R channel down to baseband, so that it can be combined coherently to produce the left and right channels.
For your project, describe
designing the filter to isolate the pilot done
generating the 38 kHz demodulation waveform
mixing the L-R signal down to baseband
generating the two stereo components.
how do you convince yourself that it is working?
You may need a phase adjustment to compensate for any delays in generated the 38 kHz waverform.
One additional enhancement is to compensate for the high frequency enhancement (equalization) we talked about in class, that we also omitted in Lab 5.
APRS Decoder
There are many things to improve with the APRS decoder. In practice these operate continuously on a stream of data. Everything has to happen automatically. Several things to automate are
Packet Detection and Level Detection
How can you efficiently scan the incoming signal to detect packets reliably, and determine an optimum level for bit detection. This would involve maintaining an estimate of the current noise level.
Synchronization
How can you choose the alignment for decoding? We did this by hand in the lab. How could you automate this?
Error Correction
The APRS packets have a CRC code at the end of the packet. For this project, there are several things to do
locate the CRC bits, which are right before a synch waveform, just like those in the preamble
determine out how to compute the CRC from the packet, and which CRC to use
test several packets to see if the pass, and if you can correct any errors
You can choose any subset of these to work on.
ACARS
The last project involves another digital packet radio system called ACARS, for Aircraft Communications Addressing and Reporting System. This sends short text messages between the ground control and aircraft, and can contain all sorts of different information.
The system operates in several different frequencies, including around 130 MHz, which is easy for you to acquire with your rtl-sdr's. In Gqrx these signals look like this
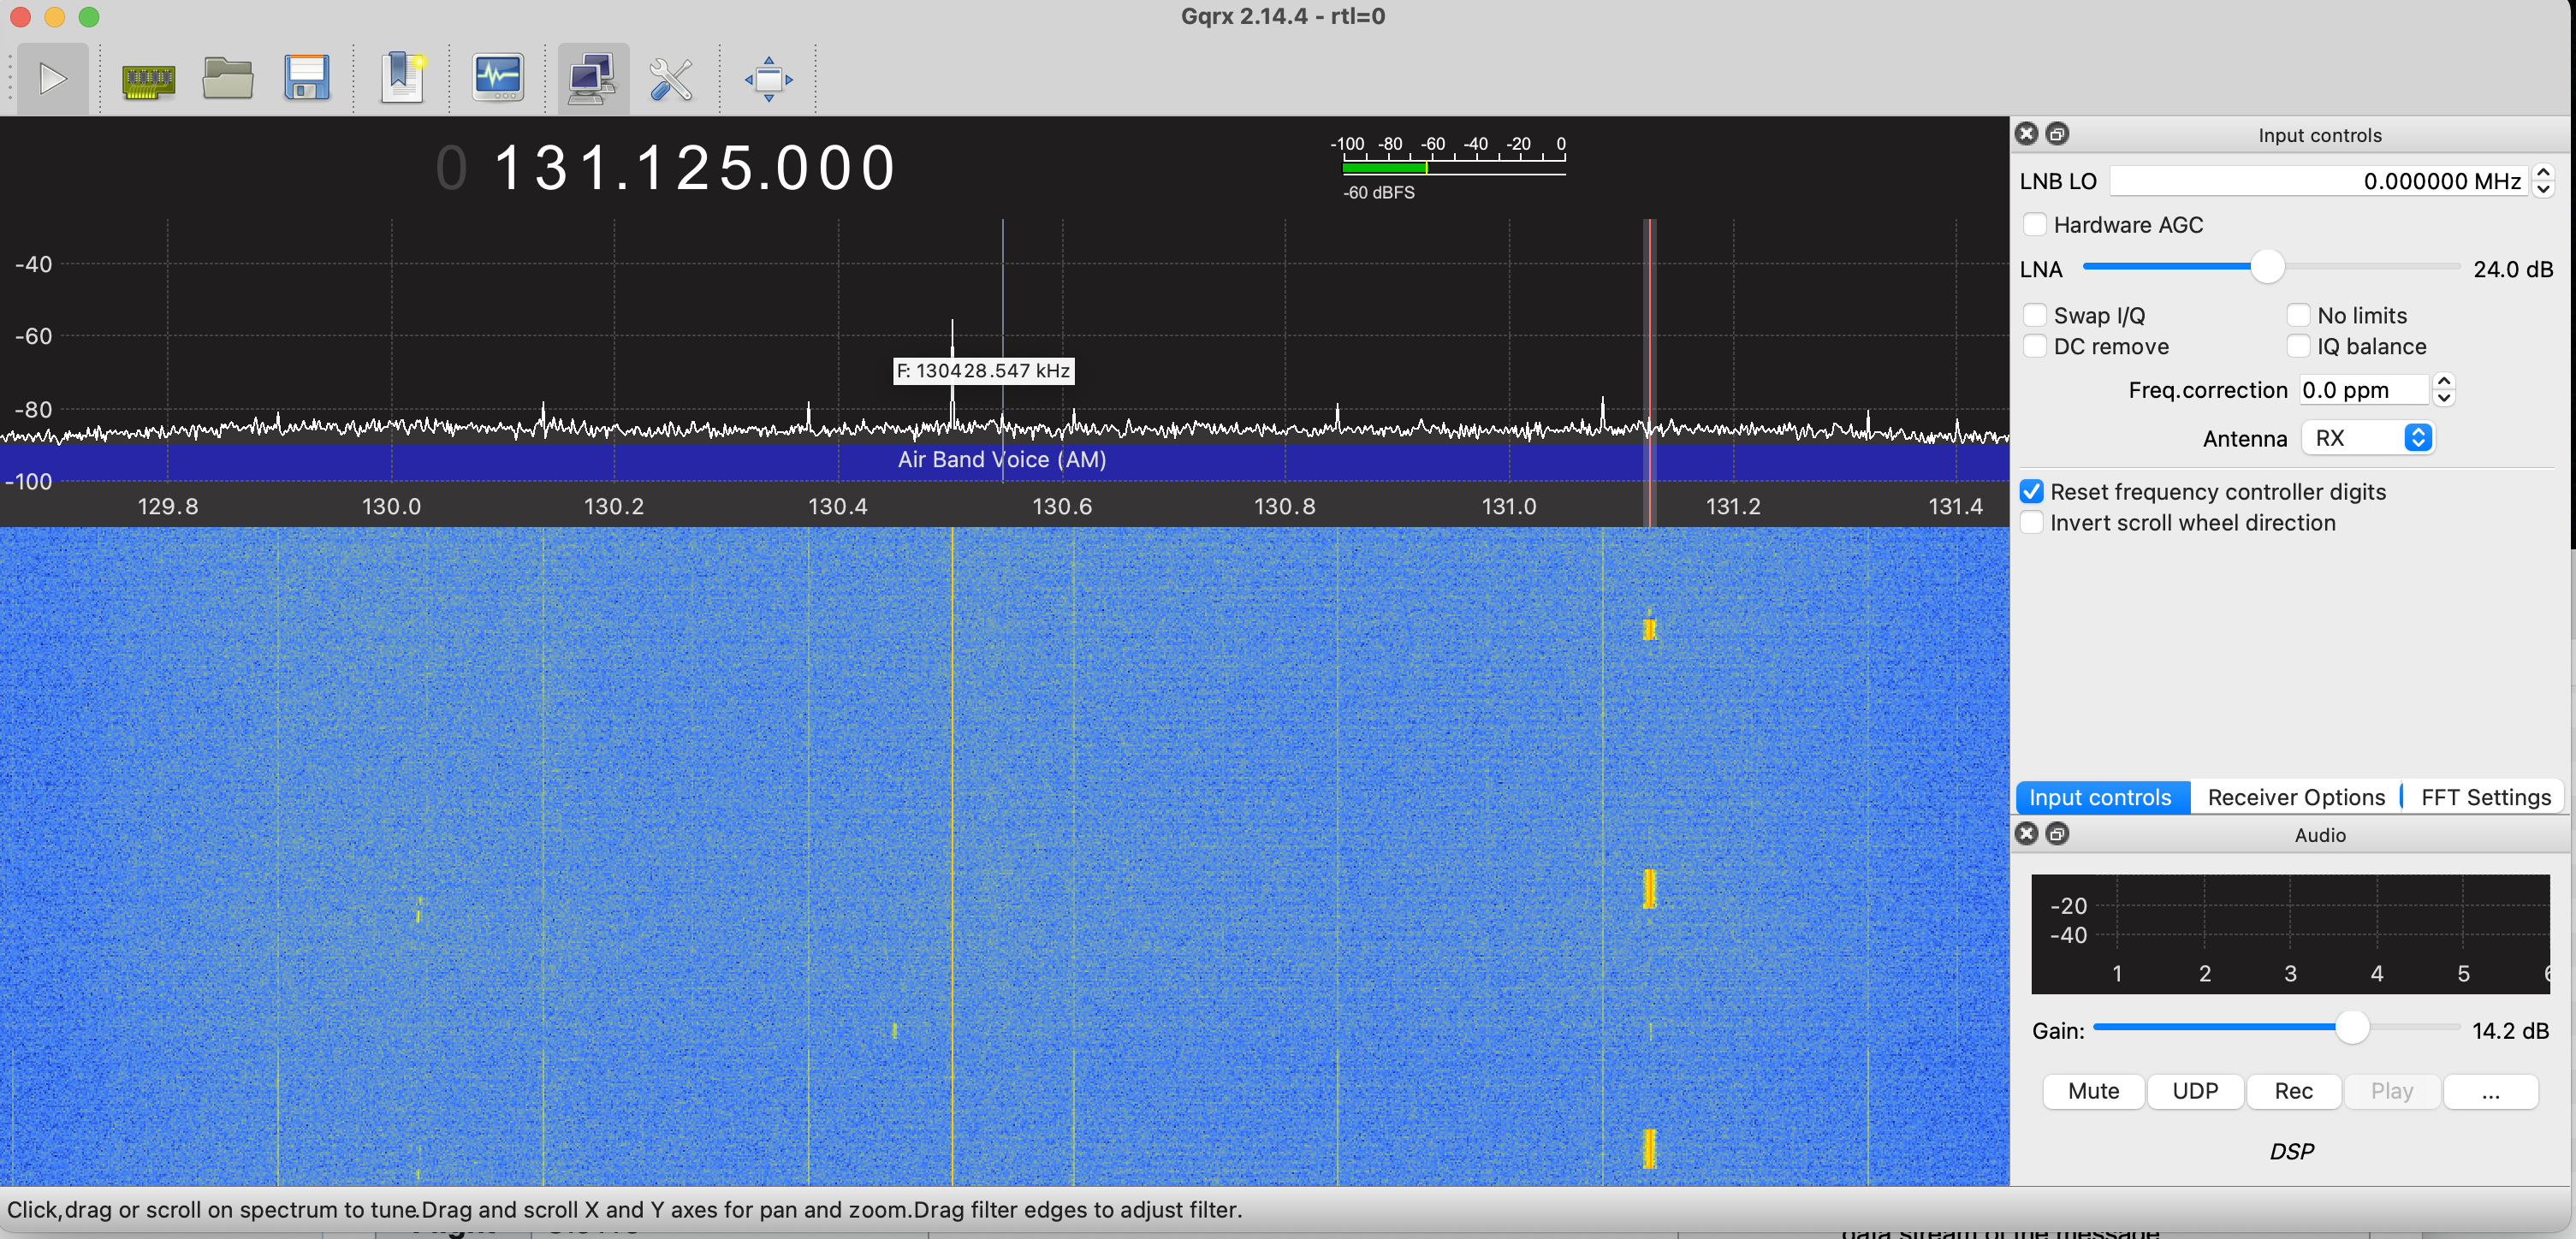
There are several ACARS frequencies. This plot shows the one at 131.125. There is another at 130.075 which I also see frequently. The rtl-sdr can capture the whole band at once.
A data file with 80 seconds of data is available here
This has several high SNR packets to look at. The data was acquired at 1.2 MHz centered exactly on 131.125 MHz. We are going to process the signal at 120 kHz, so this is a convenient sampling frequency that the rtl-sdr can easlity keep up with.
ACARS Packet Encoding: Minimum Shift Keying
The signals are amplitude modulated with a carrier present, which means we can use an envelope detector to extract the signal.
Binary data is encoded using FSK with frequencies of 1200 Hz and 2400 Hz, which is very similar to the APRS FSK frequencies we used in Lab 8. However, it turns out that this uses Minimum Shift Keying (MSK) which uses the minimum duration orthogonal signals. This is 1/2 cycle at 1200 Hz, and one cycle at 2400 Hz. These are short enough that we have to be a little more careful in decoding.
First, take the signal and decimate it down to 120 kHz. This is faster than we need (48 kHz is probably enough), but this makes it easier to see what we are doing.
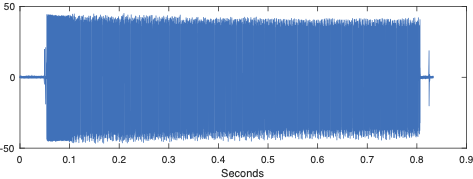
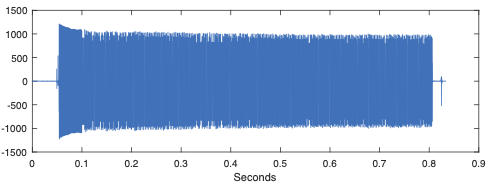
After decimation, we can extract the ACARS signal simply by taking the magnitude (envelope detect). The results is
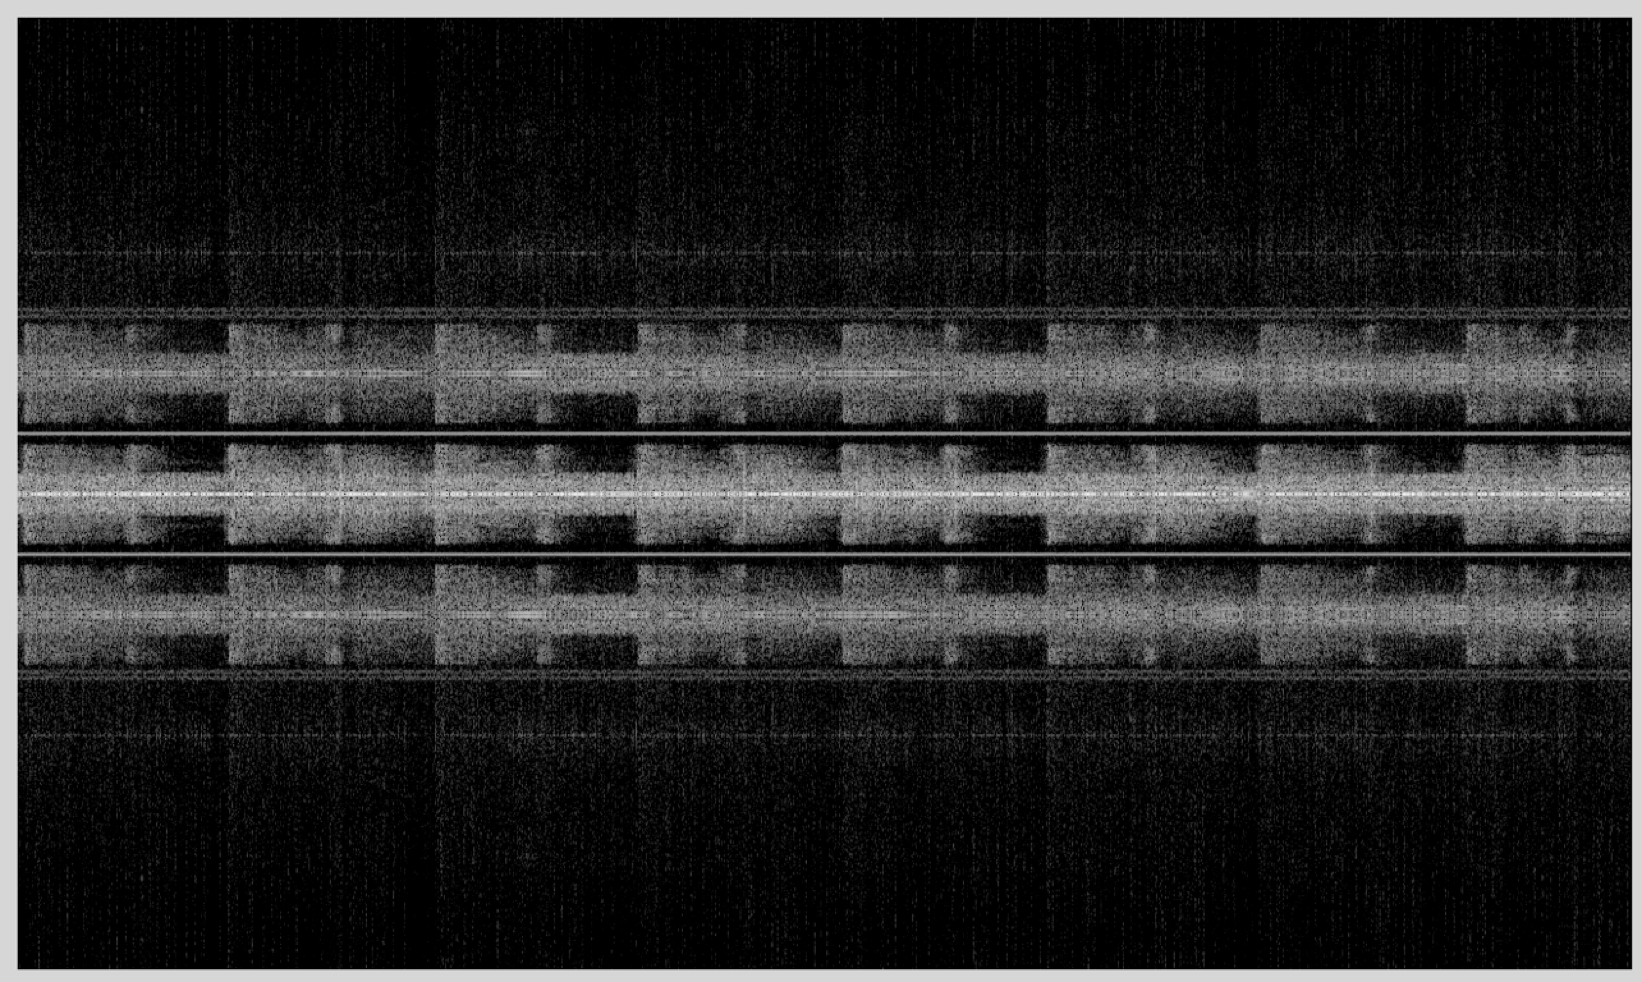
The packets themselves just contain a string of text, and can be of variable length. If we look at the spectrogram of the first part we see
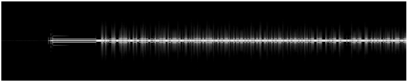
which doesn't show too much. Zooming in on the first packet we see
which shows that there is a preamble with a single tone, a synchronization after that, followed by the message. As in APRS, the bits are too short to be well resolved on the spectrogram. The AM carrier is present throughout the packet.
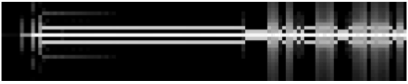
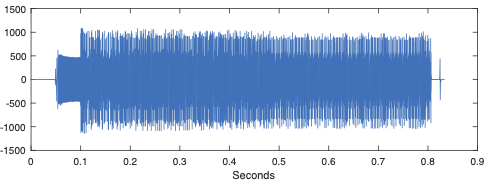
If we look at the first packet we see
We can see the AM carrier start and stop before the packet is transmitted. To see more, we zoom on on first part
The preamble and synchroniation are obvious, followed by the packet data.
The modulation scheme used here is Minimum Shift Keying, or MSK. The two symbols that are uses are
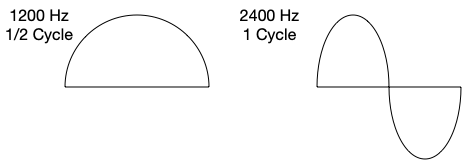
A zero is sent as 1/2 cycle at 1200 Hz, and a 1 is sent as 1 cycle at 2400 Hz. These are both sines, so that we can piece them together without discontinuities. Then to further smooth the response, we can send either the symbol or its negative. Both polarities decode to the same value. This looks like
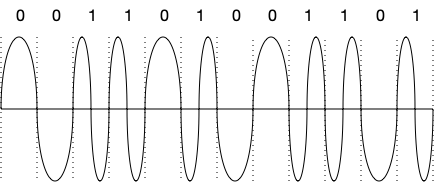
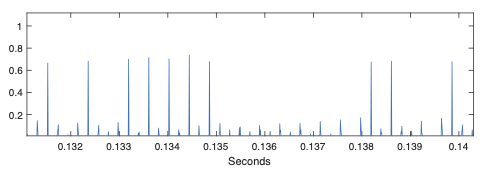
We will have to keep this in mind. If we really zoom in on the packet above, you can see the the symbols with both polarities.
The next step is to extract the bits from this waveform.
ACARS Packet: Extracting the Bits
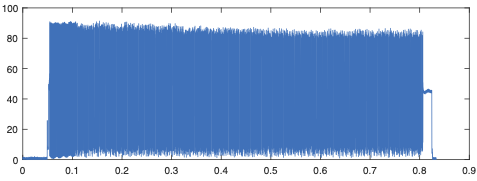
First load the file, and decimate it down to 120 kHz (a factor of 10). There is a high SNR packet right towards the beginning, which we can extract with
>> draw = loadFile('acars4.dat');
>> d = abs(decimate(draw,10,'fir'));
>> ds = d(0.75e5:1.75e5-1);
This should look like the packet above.
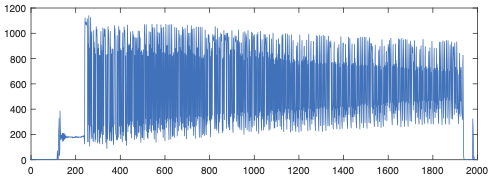
The next task is to get rid of the AM offset. We'll do this by using a narrow band lowpass filter to extract the baseline, and subtract it off. The symbols are 50 samples wide at 120 kHz, so well use a 300 sample filter to span several symbols
>> hb = hamming(301);
>> hb = hb/sum(hb);
>> dsb = ds - conv(ds,hb,'same');
The results looks like this
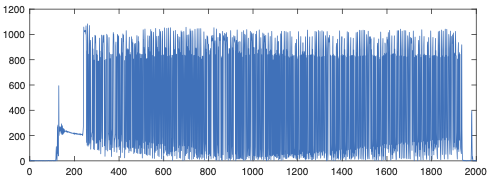
Then for visualization if we take the absolute value, so that both polarities are positive, we see
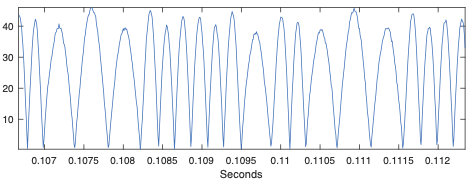
Keep the polar data, though, we'll need that.
To find the symbols, we'll convolve the signal with each of them, just as we did for APRS last week. The symbols are 50 samples long at 120 kHz, so these are
>> f1 = sin(pi*[0:49]/50);
>> f2 = sin(2*pi*[0:49]/50);
>> d1 = conv(dsb,f1,'same');
>> d2 = conv(dsb,f2,'same');
Check f1 and f2 to make sure they look like you expect.
After filtering the result is
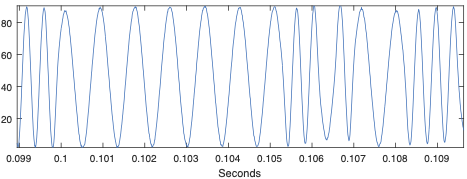
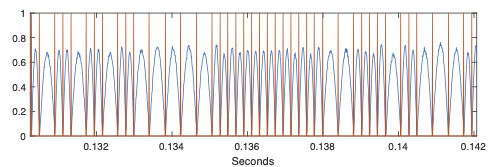
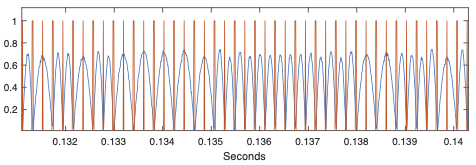
It isn't obvious that filtering has helped us much! If we plot both together, zooming in shows what is happening
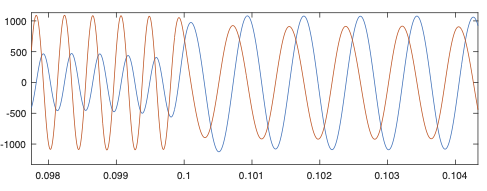
The blue trace is the 1200 Hz filter, and the red trace is the 2400 Hz filter. The key thing with MSK is that the two symbols are orthogonal, but only when they are synchronized. There is a large signal in the other channel if the alignment isn't perfect. In the segment of the signal above after 0.101, the symbols are all 1200 Hz. At the blue peaks, the red waveform is zero. This is where we need to sample to isolate the two bit streams. The red peaks could be sampled at either peak, depending on the polarity and timing. Also, recall that both polarities are used.
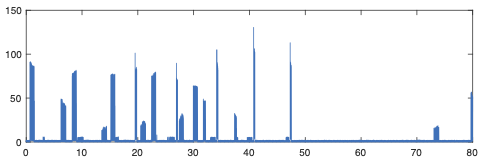
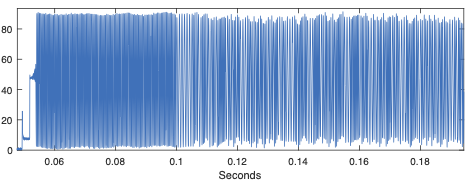
The symbols are 50 samples wide, so for this packet we just need to find the offset so we hit the peaks of the waveform. We can do this with the eye diagram like last week. An easier way is to note that errors in timing cause the signal amplitude to decrease, since the samples will miss the peaks. If you plot
>> plot(abs(d1(n0:50:end));
and adjust n0 to maximize the signal across the waveform, that is a good estimate of the delay. These examples show what it looks like if n0 is too small, and about right
Check d2 also, to make sure it is also aligned at the same time. The frequency actually drifts during the packet, so we should really use a phase locked loop to synchronize, which we'll talk about shortly.
At this point, you have your bits! You can extract them as
>> b1 = abs(d1(n0:50:end) > thr;
>> b2 = abs(d2(n0:50:end) > thr;
Choose the threshold so that a bit is only set in one channel or the other.
In your report, included stem plots of the bits from 200:399 samples for each of the two channels.
ACARS Packet Synchronization
You can skip this part if you'd like and go on to decoding the packet in the next section. The packet from the first part doesn't require more sophisticated synchronization. However, some of the other packets do. This also leads to a simpler way to detect the bits.
Some of the other packets have enough frequency drift that simply estimating the delay isn't enough. If we break the raw signal into 50 sample segments and make a 2D image, the packet above loots like the top plot below. It is roughly horizontal, and choosing one horizontal row would capture the decoded signal.


In the second of the plots, the frequency is drifting, and choosing one horizontal row would work for the start of the packet. But by the end, it has drifted almost half a symbol width. This is the first part of the packet, so by the end the drift is enough that the decoding fails.
In order to track the frequency over the pulse, we'll use the original signal, and the fact that each symbol is a part of a sine wave that starts and ends at zero. If we find the zeros in the waveform, we've found the ends of the symbols. These will be space 50 samples apart. We'll also get zeros in the middle of the 2400 Hz tone, spaced by 25 samples from the symbol ends.
We can find the zeros by starting with the carrier suppressed signal and looking for sign changes
>> clk = (dsb(1:end-1).*dsb(2:end)) < 1;
>> Clk = [clk; 0]
where we've appended a zero to keep everything the same length. If we plot clk and the magnitude of the signal together, and zoom in we see we have found the zeros, and that the spacings vary from 25 to 50 samples as expected
This is close to what we want. We'd like the samples to be centered on 1200 Hz symbols. To do this we convolve with a filter that passes 1200 Hz, and all of its harmonics. This has taps separated by 50 samples, and a low pass envelope. There is a synchronization interval of 13 symbols after the preamble, so we'll use a filter that is three times wider to make sure this is spanned.
>> h = zeros(1,39*50);           % 3*13 symbols, 50 samples/symbol
>> h(1:50:39*50) = hamming(39);  % Every 50th point is a sample of a Hamming window
>> clk = conv(clk, h, 'same');   % filter to fill in missing samples
>> clk = clk > 0.1;              % Make clk binary
The result is
Now clk is evenly spaced at 25 samples, at the start, middle, and end of each symbol. If we multiply the clk by abs(dsb),
>> b1 = (clk.*abs(dsb))
we'll get the bit stream for the 1200 Hz channel, since it the symbols are non-zero in the middle.
This is enough to decode the packet. First threshold the result,
>> b1 = b1 > 0.3;
then start at the beginning and search for the first non-zero sample. Subsequent samples should be 50 samples later, but may be a sample earlier or later, and may be one or zero. You can detect the sequence of bits in a while loop, iteratively looking of the next sample, and correcting for frequency drift a sample at a time.
Once you have the timing waveform, you can use it to sample the filtered signals from the previous part. This will have better SNR, but isn't really necessary for high SNR packets. Make sure to include the 25 sample delay from convolving with each of the two filters.
Note For decoding in the next part, add two (or more) zeros to the 1200 Hz bit sequence. The first byte in the packet includes two zero bits in from the preamble from the 1200 Hz channel.
You can generate the 2400 Hz bit stream by negating the 1200 Hz bits. The bits for the packet are “1” for 2400 Hz, and “0” for 1200 Hz.
ACARS Packet Encoding: Decoding the Bits
The next step is to decode the line coding. Instead of NRZI encoding, this uses a 2400 Hz tone to indicate the this bit is the same as the previous one, and 1200 Hz tone to indicate that the bit has flipped. Start at one, and work through the waveform one bit at a time.
The packet is just an array of bytes that are encoded as 7-bit ASCII characters with an added 8th parity bit. The bytes are sent in little-endian order. The parity bit is odd, contrary to many web sources.
There are quite a few standard fields, including several that are the same in every packet. This will help you find the beginning of the actual packet data, and help you debug your decoder. These are all described here
Decoding ACARS from All Things SDR
The first bytes after the preamble are
1 1 0 1 0 1 0 1    '+'   Character
0 1 0 1 0 1 0 0    '*'   Character
0 1 1 0 1 0 0 0   <Syn>  bit sync
0 1 1 0 1 0 0 0   <Syn>  bit sinc
1 0 0 0 0 0 0 0   <SOH>  start of header
The bits are in the order they are in the packet, leftmost first. These are the same for every packet. The preamble bits are all one, so you can find the beginning of the packet by looking for these bytes. Note that the first two bits of the ’+’ are 1, which is the same as the preamble.
The web page describes additional fields. For now we'll focus on the aircraft registration number, flight number, and whatever is included in the text field. Some of the packets don't have a text field, and are less interesting. Look the aircraft ID and Flight up on the web. The packet we were looking at above is from a Boeing 737 flying for United.
To help you display your packet, reshape the bit stream into an 8xN array, where N is the number of bytes. Then call
function db = decode_bytes(b)

%
%  b  is an 8 x N array of ones and zeros
%  db is the 7 bit integer for each set of bits
%
%  print the entire string with
%     sprintf('%c',db);

[n m] = size(b);

db = []

for jj=1:m
    cb = b(:,jj);
    cbs = sprintf('%d%d%d%d%d%d%d%d',cb);
    cbv = cb(1)+cb(2)*2+cb(3)*4+cb(4)*8+cb(5)*16+cb(6)*32+cb(7)*64;
    display(sprintf('%3d %s %x %c',jj, cbs, cbv, cbv))
    db = [db cbv];
end
There are several other packets in the matlab file. See if you can decode some of these also. Try to make your decoder as automatic as you can.
Your Choice for a Project Topic
You are also welcome to come up with your own project. This could be improving something from a previous lab, or something completely new. There are lots of possibilities. For example, figuring out exactly what the FSK key fobs are doing would be interesting. For the key fobs that just send out a probe, how does the car respond? Another option is decoding the digital RDS signal in the FM spectrum. There many references online, and example code, to help you figure this one out.